
What Is Concept Drift in Machine Learning?
Concept drift is an idea that applies to machine learning models, and more broadly to data analysis. It refers to a situation where the relationship between input data and a target variable, which the model is trying to predict, changes over time in unforeseen ways. This can lead to a decrease in model accuracy.
Concept drift is a challenge that arises in machine learning models, primarily in the domains where the data, and the objects being studied, are dynamic in nature and change frequently. A few examples are stock market predictions, credit card fraud detection, customer churn prediction, and email spam prediction.
Concept drift is not a flaw or a bug in the machine learning model. Instead, it’s an indication of a change in the real world that the model was not trained to anticipate. These changes could be due to various factors like changes in customer preferences, market conditions, or global changes like wars, cultural changes, or new technologies, which can all alter consumer behavior.
Concept Drift (Real Drift) vs. Data Drift (Virtual Drift)
The terms concept drift (also called real drift) and data drift (also referred to as virtual drift) may sound similar, but they refer to different aspects of changes in data over time.
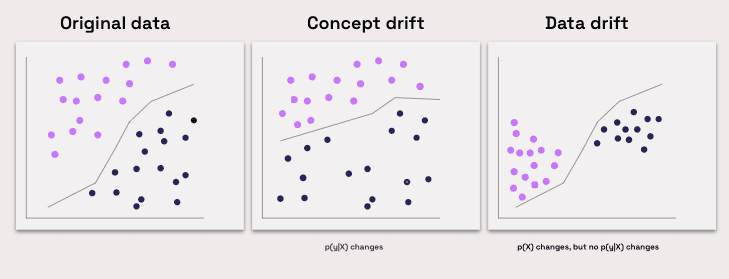
Data drift refers to changes in the structure of the data, the distribution of independent variables, or the input features over time. These changes can be due to different data sources, changes in data collection methods, or changes to the data processing pipeline. They could also be due to changes in the real-world phenomena being studied, but in a way that doesn’t fundamentally change the relation between the input and output variables.
An example of data drift is where a certain category of consumers significantly grows over time. This can affect model accuracy, but it doesn’t fundamentally change how the model should make its predictions.
Concept drift refers to changes in the relationship between the input features and the target variable over time. While data drift is mainly about the change in the input data, concept drift is about the change in the expected model outputs.
For example, in recent years Generation Z became a major buying force in the U.S. and other economies. Gen Z consumers have different behaviors and preferences from previous generations. Models trained on consumer data from previous generations might not be able to make accurate predictions given data collected from Gen Z consumers.
Concept Drift Examples
To better understand concept drift, let’s look at some of the common types of concept drifts.
Sudden (Abrupt) Drift
Sudden or abrupt drift refers to a situation where the target concept changes suddenly at a particular point in time. For instance, suppose you have a machine learning model for predicting the sales of a particular product. If a competitor suddenly releases a similar product at a lower price, the sales of your product might drop abruptly. This sudden change in the target variable is an example of sudden drift.
Incremental Drift
Incremental drift refers to the situation where the target concept changes gradually over a period of time. It’s more common than sudden drift and often harder to detect. For example, consider a machine learning model for predicting customer churn in a telecom company. Over time, customer preferences and competitors’ offerings may change gradually, causing a slow change in the churn rate.
Seasonal (Cyclical) Drift
Seasonal or Cyclical Drift refers to the situation where the target concept changes in a predictable pattern over a specific period. Consider a machine learning model for predicting ice cream sales. The sales would be high during the summer and low during the winter. This predictable, cyclical change in the target concept is an example of seasonal drift.
Concept Drift Detection Methods
Kullback-Leibler Divergence
Kullback-Leibler (KL) Divergence, also known as relative entropy, measures the difference between two probability distributions, P and Q, typically representing the distribution of data at two different time periods. It is calculated using the formula:
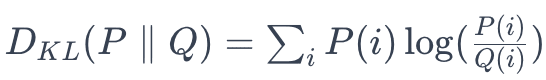
In concept drift detection, you would calculate the KL Divergence between the distribution of a feature or prediction outcomes at different times. A large divergence value indicates a significant shift, suggesting concept drift.
The KL Divergence method is particularly useful when the data distributions are complex and not easily separable. It is also beneficial in cases where the data distributions are not known in advance. However, this method is not symmetric, meaning that the divergence of distribution P from Q is not the same as that of Q from P. Also, KL Divergence requires careful handling of zero probabilities and may struggle with multi-dimensional data.
JS Divergence
Jensen-Shannon (JS) Divergence is a symmetric and smoothed version of KL Divergence. It is calculated as the average of the KL Divergence between each distribution and the mean of both distributions. A higher JS score indicates a more significant drift.
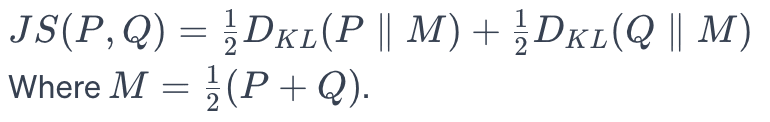
In practice, JS Divergence provides a more stable and interpretable comparison between distributions over time. It is symmetric, unlike KL Divergence, and therefore provides a more balanced measurement.
This method balances sensitivity and specificity, making it suitable for a wide range of applications, including sudden, incremental, and gradual drifts. However, the JS Divergence method requires a good understanding of the data distributions involved.
Kolmogorov-Smirnov Test
The Kolmogorov-Smirnov (KS) Test quantifies the distance between the empirical distribution functions of two datasets. It computes the supremum (the least upper bound of the set of distances) between the cumulative distribution functions (CDF) of two samples. This expression compares the empirical CDFs of two samples, denoted as Sn1 and Sn2:
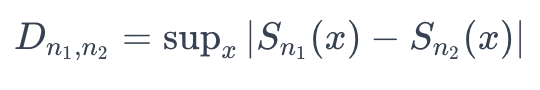
A significant value of D, often assessed against a critical value from the KS distribution, indicates a notable difference in distributions, signaling potential concept drift.
The KS test is particularly effective for univariate data and is widely used due to its non-parametric nature. It is particularly useful in detecting sudden concept drift, where the distribution undergoes a drastic change, but is less effective at detecting gradual or incremental concept drift.
CUSUM and Page-Hinckley (PH)
CUSUM (Cumulative Sum) and PH (Page-Hinckley) are statistical methods that are often used in quality control and change detection, including concept drift detection. Both methods work by monitoring the cumulative sum of differences between the actual and expected values and signaling a drift when this sum exceeds a certain threshold.
CUSUM detects changes by accumulating the sum of deviations from a mean or expected value. It calculates the cumulative sum as follows:
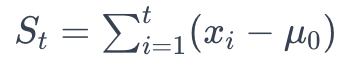
where xi are individual observations and μ0 is the expected value. A significant shift in St suggests a drift. The Page-Hinckley test extends this by introducing a threshold, δ, and tracking the minimum of the cumulative sum, mt. A significant difference between St and mt, exceeding δ, indicates a drift.
The CUSUM method is robust and can detect small shifts in the mean of the data distribution, making it particularly useful in detecting gradual concept drift. On the other hand, the PH method is designed to detect abrupt changes in the data distribution, making it suitable for detecting sudden concept drift.
Tree Features
The tree features method involves using decision trees or random forests to capture the features of the data distribution and detect changes in these features over time. For instance, in a decision tree, you would observe the changes in the splitting criteria of nodes.
One practical approach is to build trees on sequential data batches and compare the feature importance or splitting nodes for each batch. Significant changes in the structure or feature importance rankings indicate a drift.
The tree features method is particularly useful when dealing with high-dimensional data. It allows for a comprehensive analysis of the data distribution by capturing the relationships between different features. This makes it an effective tool in detecting complex concept drift that may not be easily detectable using other methods.
5 Ways to Prevent Concept Drift
1. Online Learning
Online learning is one of the most effective ways to combat concept drift. In online learning, the model continually learns from new data as it becomes available. Instead of being trained once and then left to make predictions, an online learning model is constantly updated and fine-tuned to reflect the most recent data.
However, implementing online learning requires careful consideration. The critical challenge is to maintain a balance between the model’s adaptability and stability. If the model adapts too quickly to new data, it may become too sensitive to noise or anomalies in the data. On the other hand, if the model adapts too slowly, it may fail to capture important changes in the data. Therefore, the learning rate should be adjusted carefully to ensure that the model adapts appropriately to new data.
2. Periodically Re-Train the Model
Another strategy to prevent concept drift is to periodically re-train the model. This involves taking the existing model and re-training it on the most recent data. This approach allows the model to stay up-to-date with the latest trends and patterns in the data, thereby reducing the likelihood of concept drift.
However, re-training a model can be computationally expensive, particularly for large datasets or complex models. Therefore, this strategy may not be feasible for all applications. Furthermore, re-training a model can also introduce a risk of overfitting, particularly if the new data is significantly different from the original training data, or the sample size is too small. Therefore, it is important to validate the model after re-training to ensure that it is still performing well.
3. Periodically Re-Train on a Representative Subsample
An alternative to re-training the entire model is to re-train it on a representative subsample of the data. This approach involves selecting a subset of the data that accurately reflects the current data distribution and re-training the model on this subsample. This can be a more efficient way to update the model, as it requires less computational resources compared to re-training the entire model.
However, selecting a representative subsample is not a trivial task. It requires a good understanding of the data and the underlying data distribution. Moreover, there is a risk that the subsample may not accurately reflect the entire data distribution, leading to biased or inaccurate predictions. Therefore, this strategy should be used cautiously and in conjunction with other strategies to prevent concept drift.
4. Ensemble Learning with Model Weighting
Ensemble learning is another effective strategy to combat concept drift. In this approach, multiple models are trained, each with a different set of parameters or features. The predictions from each model are then combined, with each model’s contribution weighted according to its performance.
This approach can be particularly effective in dealing with concept drift, as it allows the ensemble to adapt to changes in the data distribution. If one model becomes less accurate due to concept drift, its weight can be reduced, and the weight of other models can be increased. This allows the ensemble to maintain good predictive performance, even in the face of concept drift.
However, ensemble learning with model weighting can be computationally expensive, as it requires training and maintaining multiple models. It might also raise explainability challenges, because it might be difficult to understand how the ensemble model reached a certain decision.
5. Feature Dropping
Finally, feature dropping can be used as a strategy to prevent concept drift. This involves identifying and removing features that are contributing to concept drift. For example, if a feature’s distribution changes significantly over time, it may lead to concept drift. By dropping this feature from the model, the impact of concept drift can be reduced.
However, feature dropping should be used cautiously. Removing a feature can lead to a loss of information, which can negatively impact the model’s predictive performance. Therefore, it is important to carefully evaluate the impact of dropping a feature before implementing this strategy.
Testing and Evaluating ML Models with Kolena
We built Kolena to make robust and systematic ML testing easy and accessible for all organizations. With Kolena, machine learning engineers and data scientists can uncover hidden machine learning model behaviors, easily identify gaps in the test data coverage, and truly learn where and why a model is underperforming, all in minutes not weeks. Kolena’s AI / ML model testing and validation solution helps developers build safe, reliable, and fair systems by allowing companies to instantly stitch together razor-sharp test cases from their data sets, enabling them to scrutinize AI/ML models in the precise scenarios those models will be unleashed upon the real world. Kolena platform transforms the current nature of AI development from experimental into an engineering discipline that can be trusted and automated.
Among its many capabilities, Kolena also helps with feature importance evaluation, and allows auto-tagging features. It can also display the distribution of various features in your datasets.
Reach out to us to learn how the Kolena platform can help build a culture of AI quality for your team.